 Волоконно-оптические датчики температуры INNO ,Системы контроля температуры.
When the natural environment temperature changes, the concrete box girder bridge structure will undergo deformation and stress, which will directly affect the safety, durability, and applicability of the concrete structure. The actual temperature of the bridge structure has a direct impact on the linearity and internal forces of the bridge. Следовательно, it is necessary to monitor the actual temperature of the bridge structure during the construction process to effectively grasp the impact of temperature on the stress monitoring results of the bridge during construction.
Волоконная решетка Брэгга (ВБР) sensing technology can overcome the shortcomings of traditional monitoring techniques and meet the technical requirements of distributed, high-precision, long-distance, and long-term monitoring of bridge structures. Due to the use of light for signal propagation, sensors are no longer affected by noise and have good anti electromagnetic interference and moisture-proof functions, which can provide more advanced means and methods for the health diagnosis and safety monitoring of bridge engineering structures. Since FBG sensors were first embedded in concrete for monitoring in 1992, their application in civil engineering has been widely explored and studied in China, expanding from experimental research to practical engineering structures such as bridges and tunnels. Среди них, real-time monitoring of stress during the construction phase of the bridge was carried out using fiber optic sensors, and certain research results were achieved. In this paper, a new type of FBG sensor with embedded stainless steel sleeve protection was used to monitor the hydration heat temperature of the C60 concrete of the bridge in real time after pouring. Fiber optic temperature sensors were embedded in the flanges, web plates, and bottom plates of the section. This article provides a detailed introduction to the installation and monitoring process of the sensor, verifies the performance of the new оптоволоконный датчик температуры under complex construction conditions, and monitors the differences and changes in the hydration heat temperature of the box girder top plate, web plate, and bottom plate during winter construction. It provides corresponding reference for the study of hydration heat temperature field in the construction of C60 concrete for super long span bridges in similar mountainous environments.
Project Overview
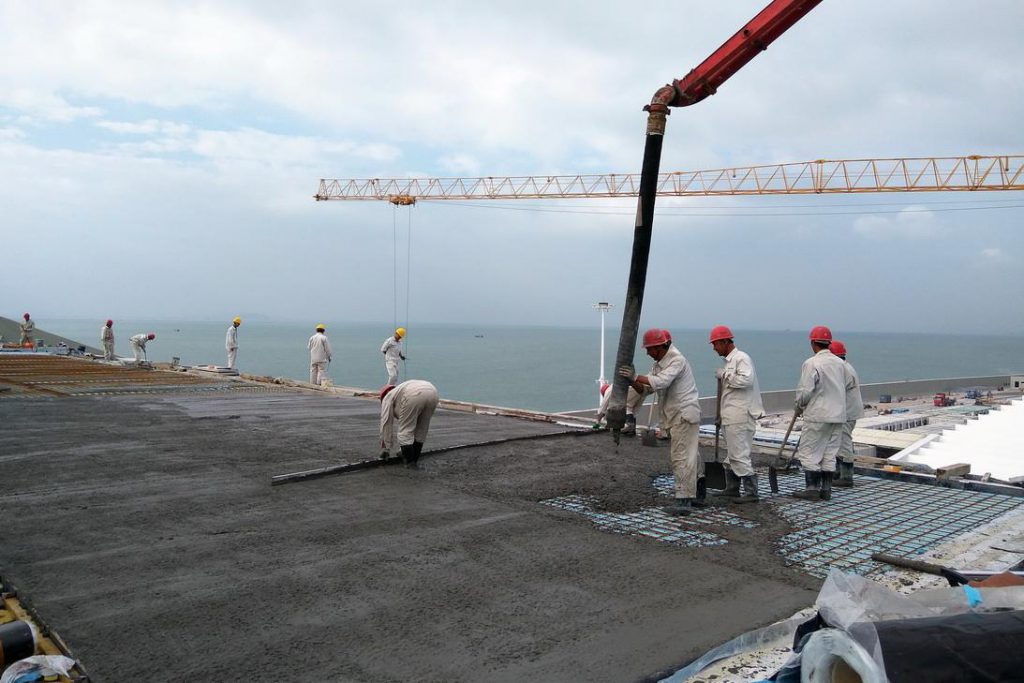
The bridge is located in a mountainous area with many high mountains, deep valleys, and steep terrain. Its geological conditions are very complex, with unpredictable weather and excessive rainfall, making construction difficult. В то же время, the cast-in-place bridge beams in the project were poured with C60 high-grade concrete, breaking the conventional practice of using C55 grade concrete for bridges of the same type. Although the strength of concrete is only increased by 5MPa, it greatly increases the difficulty of concrete construction control and monitoring. In order to monitor the effect of hydration heat and temperature changes generated by C60 concrete during bridge construction on the stress of the bridge, a pre embedded fiber optic grating sensor is used to monitor the temperature changes during and after the concrete curing process in real time.
Temperature Monitoring of Box Girders Based on Fiber Bragg Grating Sensing
Principle of Temperature Monitoring Based on Fiber Bragg Grating Sensors
Bragg fiber Bragg grating is formed by single-mode germanium doped fiber being irradiated with ultraviolet light to form a grating technology. When the fiber core of the fiber Bragg grating is subjected to external temperature or stress, the spacing of the grating will change, causing a change in the wavelength of the reflected light. According to the theory of mode coupling, when a broadband light passes through a fiber optic grating, a specific wavelength of light (длина волны: λ B) Will reflect back, its wavelength λ B satisfies Bragg’s theorem: 2.2 Sensor layout diagram. Due to the width of the top plate being 12m, which is the main sunlight area and also the main heating and cooling surface, 5 sensors are distributed equidistantly for monitoring, with two belly plates and one bottom plate. A total of 8 temperature sensors are numbered S1-S8.
The variation pattern of temperature monitoring results
The variation law of local temperature of cross-section with time
The concrete pouring time for the bridge is at night, and temperature monitoring begins the next morning after completion of pouring. The monitoring time starts at 8am. The external temperature of the bridge roof is 2 °С, and the weather is sunny to cloudy. The monitoring duration is 6 Часов, and the sampling frequency is 2Hz. The sensors on the top plate are numbered S1-S5, with S1 on the upstream side and S5 on the downstream side.
Due to the significant hydration heat generated by concrete, although the external outdoor temperature is close to 0 °С, after 12 Часов, the temperature of the bridge roof still remains close to 31 °С. By fitting the temperature time history curve, it can be observed that the temperature decreases linearly with time. S2 is at the top plate, and the thickness of the top plate of Block 12 is 45cm. It can be observed that the temperature of the top plate decreases relatively quickly, with a fitted linear slope of -7.3484, indicating that the temperature changes rapidly over time. Внутри 6 Часов, the temperature drops from 27.5 °C до 25.0 °С, and the temperature decreases by 2.5 °С.
The variation law of longitudinal and transverse distribution of cross-sectional temperature
Compared to the climate conditions in mountainous areas, there are relatively strong winds in river valleys, which have a significant impact on the dissipation of concrete hydration heat. The bridge deck of Wanlongshan Bridge is 12 meters wide, and the temperature difference of the roof is affected by sunlight and wind direction. Now compare the monitoring temperatures of the five sensors on the top plate horizontally, and the comparison results are shown in Figure 4. It can be observed that there is a significant temperature difference in the top plate along the horizontal direction. The temperature of the downstream top plate (S4 and S5) is higher than that of the upstream top plate, with a maximum difference of about 5.0 °С. This indicates that the temperature distribution of the top plate varies greatly. The main reason is that the downstream side of the bridge is first exposed to sunlight, while the upstream side of the bridge is the sunny side.
Comparing the temperatures of the top plate, web plate, and bottom plate longitudinally, it can be seen from the comparison results that the temperature of the bottom plate is 25 °С, the temperature of the top plate is 31.0 °С, and the highest temperature at the junction of the web plate and top plate is 38.0 °С. The trend of temperature change can be seen that the temperature change rates of the top and bottom plates are almost the same. The temperature time history curves of S1 and S6 are almost parallel, and the temperature slowly decreases, while S8 is basically in a stable state.
By using embedded fiber optic grating temperature sensors, real-time monitoring of the temperature of C60 high-strength concrete pouring during the construction stage of the bridge is carried out. The main monitoring content is the temperature changes of the top plate, web plate, and bottom plate, with a monitoring time of 6 Часов.
The main conclusions are: (1) Внутри 12 hours after concrete pouring, when the external temperature of the bridge is 0 °С, the temperature generated by the hydration heat inside the bridge can reach up to 40 °С, the top plate temperature is about 30 °С, the bottom plate temperature is about 24 °С, the temperature at the junction of the web plate and the top plate is 40 °С, and the temperature in other parts of the web plate is similar to that of the bottom plate, который 24 °С.
(2) There is a significant difference in the horizontal distribution of top plate temperature for large-span concrete bridges constructed in mountainous areas. The temperature difference of the top plate of the bridge is about 5 °С, and the temperature of the top plate is significantly affected by sunlight. The temperature is highest on the side near sunlight, and lowest on the sunny side, at 24 °С.
(3) The vertical distribution of temperature along the section is closely related to the local volume of concrete, such as the temperature at the junction of the top plate and the web plate, which is the highest temperature of the entire section, around 40 °С; The temperature of the bottom plate is the lowest, followed by other parts of the belly plate, and then the temperature of the top plate.
Волоконно-оптический датчик температуры, Интеллектуальная система мониторинга, Производитель распределенного оптоволокна в Китае
 |
 |
 |
