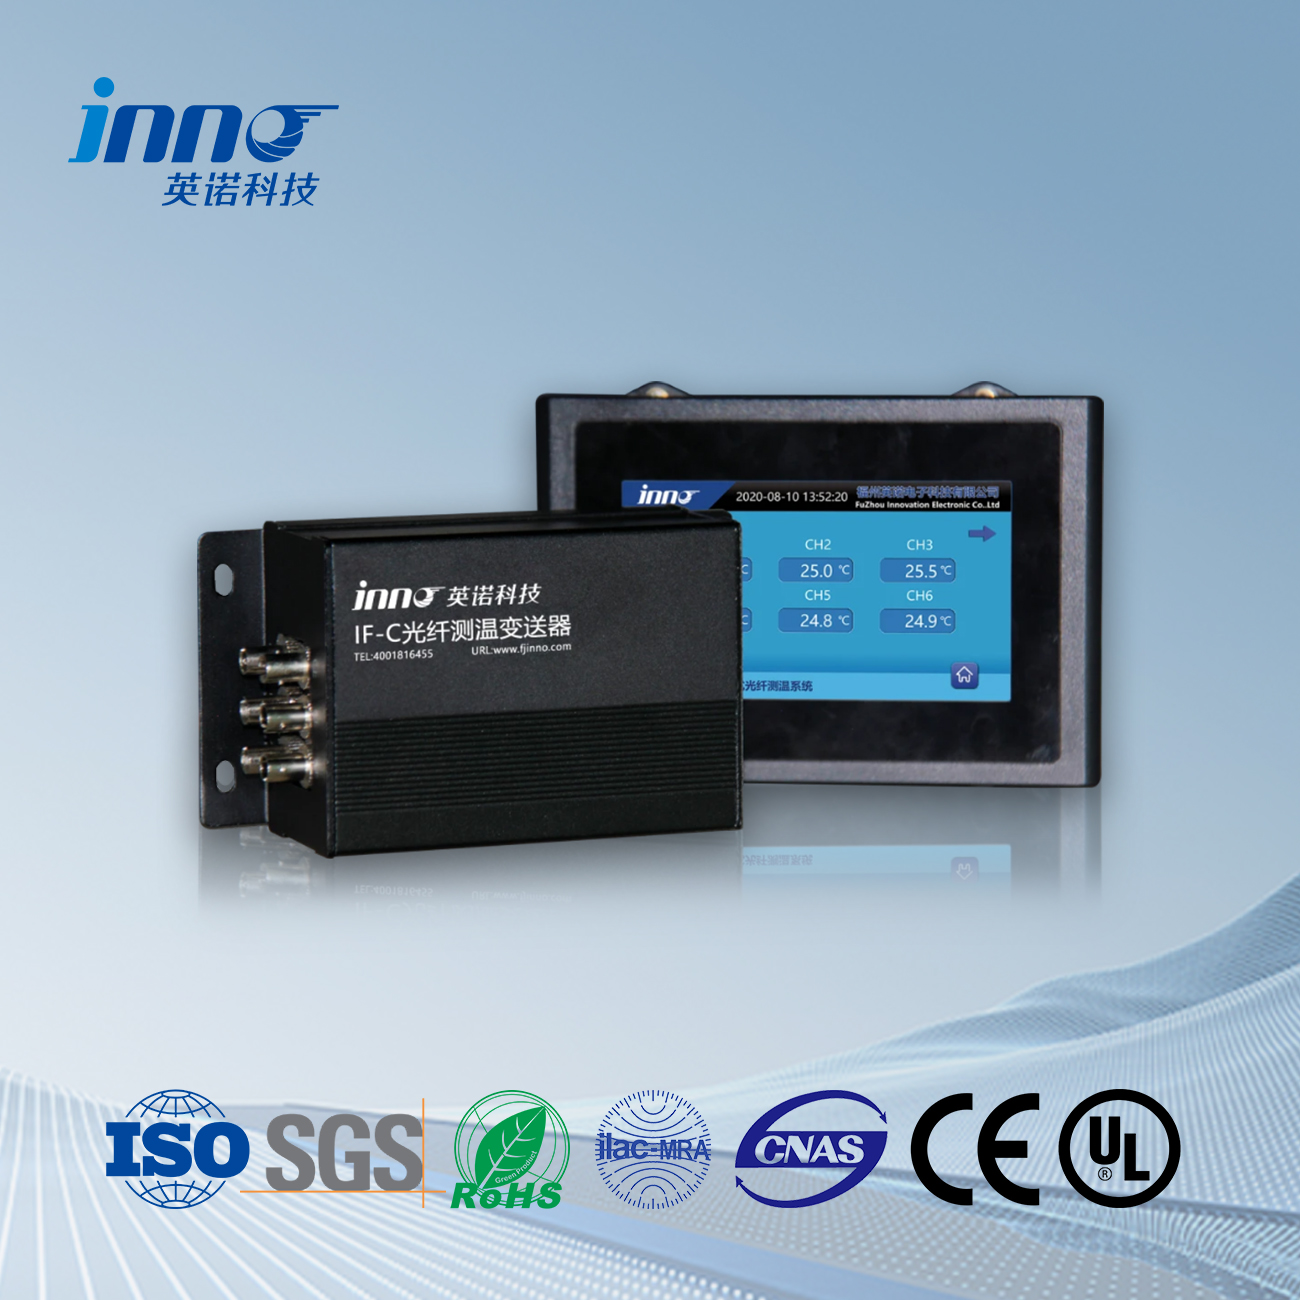
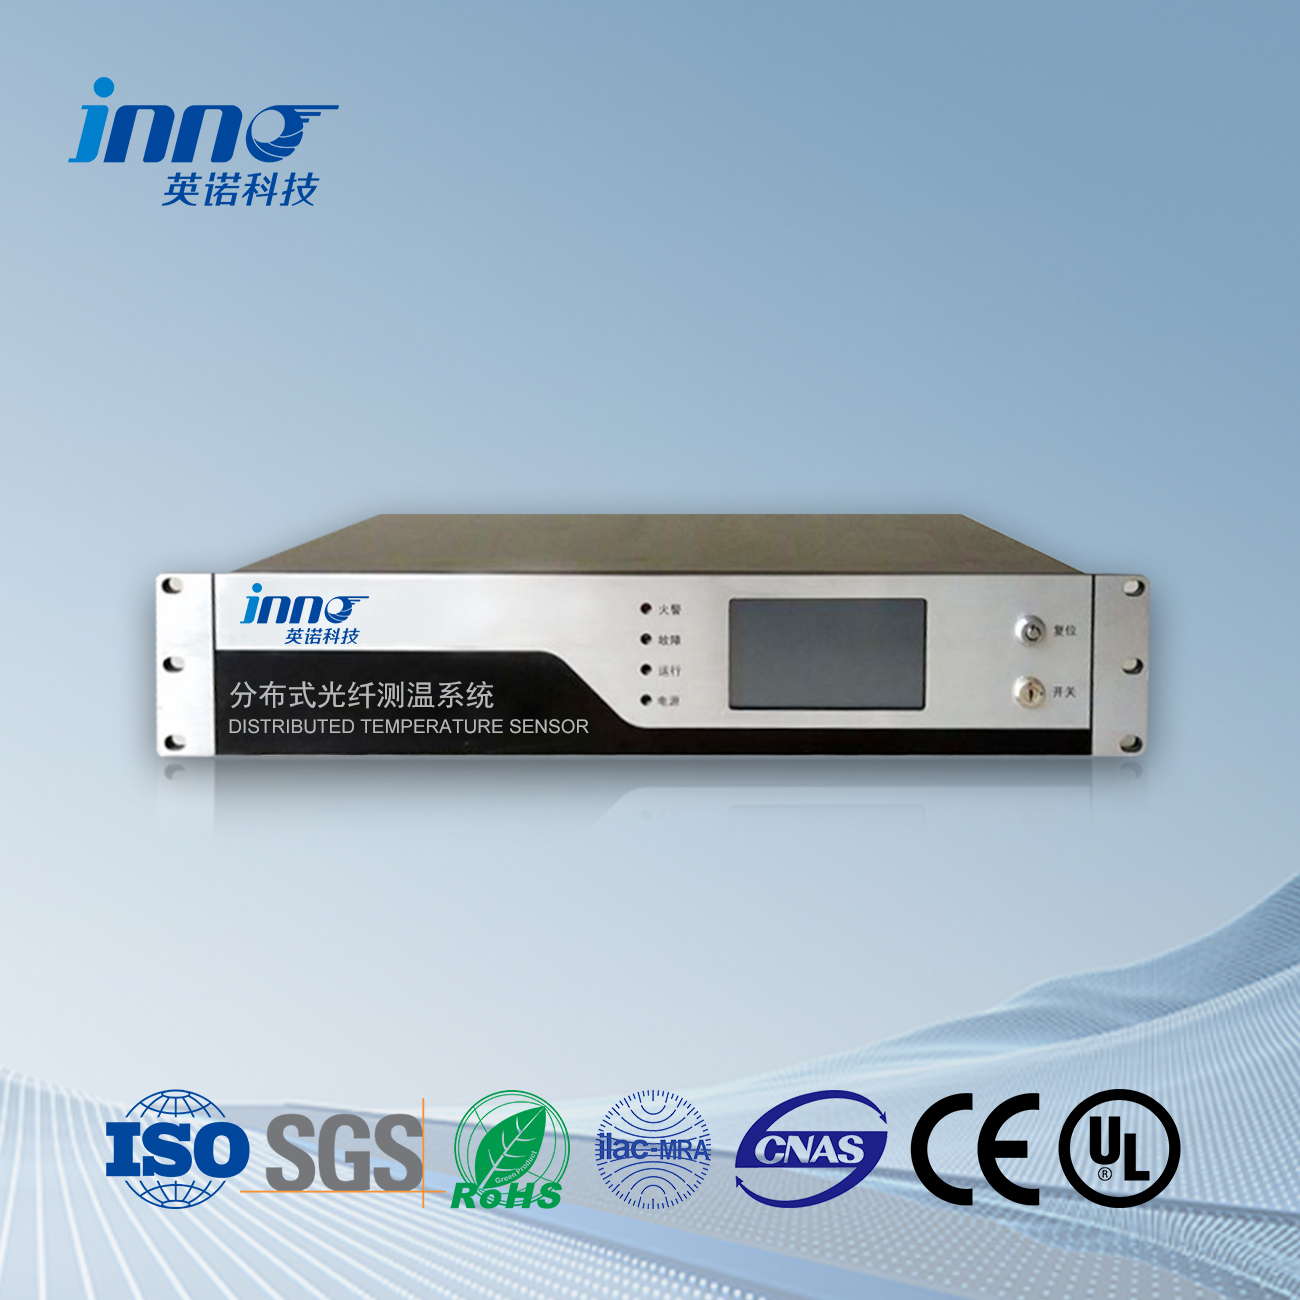
It is very simple to use, just need to perform the following four steps:
1) Insert temperature sensing optical cable
The connector of the temperature sensing optical cable must be correctly inserted into the device. The type of temperature sensing fiber optic cable connector is FC/APC. When inserting the optical cable plug, please make sure to align the protrusion on the plug with the groove in the socket, and then tighten the thread, as shown in the following figure:
When removing the connector from the adapter, please cover it with a protective cap to prevent dust from entering and affecting system performance.
2) Power on the device
Before powering on, connect the keyboard, mouse, and VGA display.
Power requirements: AC 220V, 50Hz
Connect the power cord to a power outlet
After connecting to the power supply, the system automatically starts up and runs the program.
3) Waiting for system self-test to complete
After the device is powered on, the software automatically loads and runs. After the software runs, it automatically starts detection. During the detection process, the status bar displays: System self-test… After the self-test is completed, it displays: Normal collection
4) View fiber optic cable temperature and spectrum
Switch to the temperature curve graph and view the real-time temperature of the optical cable.
Switch to the spectral curve graph and view the spectral signal of the optical cable.
1 Software operation
3.1 Software main interface
3.2 Starting Collection
Click on the menu “Sistem | Start Collection” or click on the “Start Collection” button in the toolbar.
You can set the “application parameters” to automatically collect data after the software starts.
3.3 Stop Collection
Click on the menu “Sistem | Stop Collection”, or click the “Stop Collection” button in the toolbar.
3.4 Status bar information
Column 1: Display the current working status of the system.
During system self-test, it displays: System self-test
Normal operation is to display: normal collection
Column 2: Display the current channel number and collection time being collected
Column 3: Debugging Information
3.5 Spectral curve
Select the channel number in the channel dropdown box and select “spectral curve” in the curve type dropdown box:
There are three curves in the spectral curve:
Red curve: Stokes signal curve;
Blue curve: Anti Stokes signal curve;
Green curve: the ratio curve of anti Stokes/Stokes;
The vertical axis represents the signal strength and voltage value; The horizontal axis represents the measurement position point.
The signal at around 250 points in the front is the internal fiber optic signal of the equipment, and the signal at the back is the measurement fiber optic signal.
The length of the optical fiber is displayed in red text above the curve, measured in points.
Display Zoom: Hold down the left mouse button while moving the mouse, move from the top left to the bottom right, release the left mouse button, and place it within the selected area for display. Click the left mouse button to display the access restored to the initial value.
3.6 Temperature curve
Select the channel number in the channel dropdown box and select “temperature curve” in the curve type dropdown box:
The vertical axis represents the temperature value, and the horizontal axis represents the number of position points.
The blue curve represents the temperature curve.
The red curve represents the temperature rise rate curve, measured in ℃/minute.
When the mouse moves on the temperature curve, the temperature value and temperature rise rate corresponding to the measurement point at the mouse position will be displayed in the upper right corner.
Display Zoom: Hold down the left mouse button while moving the mouse, move from the top left to the bottom right, release the left mouse button, and place it within the selected area for display. Click the left mouse button to display the access restored to the initial value.
3.7 Fiber optic parameters
Click on the menu: Setări | Fiber Optic Parameters, and the “Fiber Optic Parameters” dialog box will pop up,
Independently configure the fiber parameters for each channel.
Due to the different properties such as joint loss, loss coefficient, fusion point loss, and number of fusion points for each fiber optic cable, it is necessary to separately correct the fiber optic parameters for each channel after construction.
The left list displays channel names. Before setting a channel, select the corresponding channel number.
Starting position: The optical cable corresponds to the position of the optical cable in the software. As there is a reference fiber in the equipment, the starting position of the optical cable should be greater than the length of the reference fiber in the equipment. It is set up at the factory and does not require any modification.
Fiber length: reserved.
Demodulation coefficient: Temperature value T=a * x * x+b * x+c
un: Quadratic coefficient
b: Coefficient of first-order term
c: Constant coefficient
Import coefficient: The coefficient can be manually entered or directly imported from a file. Click “Import Coefficient” and the “Import Fiber Coefficient” dialog box will pop up:
Select a row corresponding to the fiber optic name and click the OK button.
Regional attributes: Fiber optic can be divided into multiple regions, and the attributes of each region can be configured separately. Regional attributes include: starting point of the region, temperature deviation, and transmission attenuation coefficient;
Add Area: Click the “Add” button to pop up the “Area” parameter dialog box,
Starting point position: the starting point position of the region;
Temperature deviation coefficient: The temperature deviation value in this area, the temperature measurement value plus the deviation coefficient;
Transmission attenuation coefficient: The optical fiber transmission attenuation coefficient in this area.
Delete Area: Select the row of the area to be deleted and click the delete button.
Modify Area: Double click the row of the area you want to modify with the mouse, and the “Area Parameters” dialog box will pop up.
If the optical fiber has multiple fusion points, the loss of each fusion point will cause the temperature curve to not be straight. Deci, different parameters, temperature deviation, and transmission attenuation coefficient need to be set for the area between each fusion point, as shown in the following figure:
The temperature curve corresponding to the above figure can be set in three regions, as shown in the table below:
Transmission loss coefficient of temperature deviation at the starting point of the region
1 300 0 0.000008
2 1000 2 0.0000085
3 2000 2 0.0000095
Transmission loss coefficient: affects the slope of the temperature curve, and adjusting the transmission loss coefficient of the channel can correct the slope of the temperature curve.
Example 1: Transmission loss coefficient=0.00000920
In Example 1, the set transmission loss coefficient is exactly the actual transmission loss coefficient of the optical fiber, and the blue temperature curve is relatively flat.
Example 2: Transmission loss coefficient=0.0001220
In Example 2, the set transmission loss coefficient is greater than the actual transmission loss coefficient, and the blue temperature curve slopes upwards.
Example 3: Transmission loss coefficient=0.00000620
In Example 3, the set transmission loss coefficient is smaller than the actual transmission loss coefficient, and the blue temperature curve slopes downwards.
3.8 Application parameters
Click on the menu: Setări | Application Parameters, and the “Application Parameters” dialog box will pop up
Save directory: The directory where historical data packets are saved. Click the “Select” button and a “Browse Folder” dialog box will pop up, select the directory.
Save interval: Store every fixed time in seconds. If set to 0, data will not be saved.
Each time it is saved as a separate file, one channel corresponds to one file. The files for each channel are saved separately in the corresponding channel’s subdirectory. The file name rule is: CH channel number date time. dat. Example: CH_101501002_12311.2dat.
Hide window when minimized: If checked, hide the window when clicking the minimize button and display the icon in the lower right corner of the taskbar.
Hide window after program operation: If checked, hide the window after program operation and display the icon in the lower right corner of the taskbar.
Start collection after program operation: If checked, collection will automatically start after program operation.
Language: Select the language for the program interface. Actualmente, only Chinese and English are supported. After switching languages, you must click the “OK” button, exit the program, and then run the program again to take effect.
Temperature display range: Set the range of the vertical axis in the temperature curve graph, with a default value of -50~150 ℃.
Voltage display range: Set the range of the vertical axis in the spectral curve graph, with a default value of -1 to 4.
Temperature display starting point: Since there is a portion of optical fiber inside the device, if only the temperature of the temperature measuring optical cable needs to be displayed, this value can be set to shield the temperature of the optical fiber inside the device. The default value is the internal fiber length of the device.
Display temperature rise rate curve: If checked, the temperature rise quantity curve will be displayed simultaneously in the temperature curve graph, with a red curve; If not checked, only the temperature curve and blue curve will be displayed.
3.9 Historical data
Click on the menu: Instrumente | Historical Data, and the “Historical Data” dialog box will pop up
Channel number: Select the channel number corresponding to the historical data to be queried;
Time range: Select the start and end times for querying historical data;
Query button: After setting the channel number and time range, click the “Query” button to query the historical data files that meet the conditions;
File List: The file names of the query results are all displayed in the left list. Clicking on the corresponding file name will automatically open the data file and draw the data curve in the right curve graph.
Set display parameter button: Set the display parameters of the curve graph. After clicking, un “Display Parameters” dialog box will pop up,
Set the display range of the y-axis temperature in the curve graph, with a default value of -50~150.
3.10 Data Services
Set parameters: Click on the menu: Instrumente | Data Services | Setări, and the “Server Parameters” dialog box will pop up,
TCP port number: default value is 9910
Auto start when program starts: If checked, the data service will be automatically started after the program runs;
Simulator: If there is no fiber optic cable, you can choose a simulator. The data service interface simulates a certain number of fiber optic temperature data, which is convenient for program debugging.
Start Service: Click on the menu: Instrumente | Data Services | Start, and the “Server Parameters” dialog box will pop up. After confirming that the parameters are correct, click the “OK” button.
Stop service: Click on the menu: Instrumente | Data Services | Stop.
Senzor de temperatură cu fibră optică, Sistem inteligent de monitorizare, Producător de fibră optică distribuită în China
 |
 |
 |
 Senzori de temperatură cu fibră optică INNO ,Sisteme de monitorizare a temperaturii.
