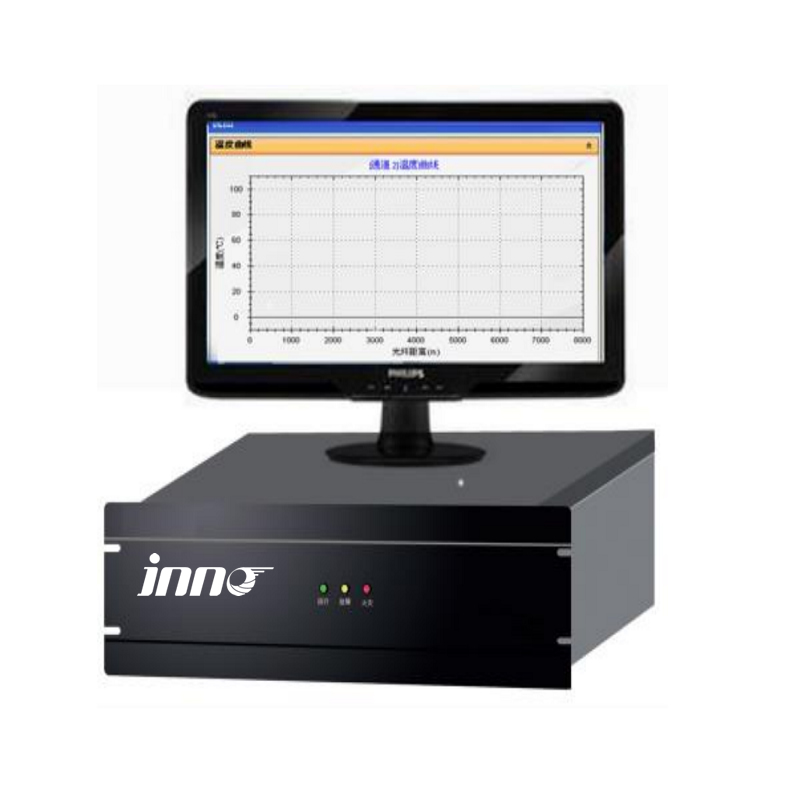
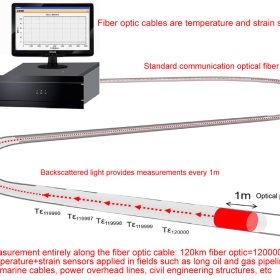
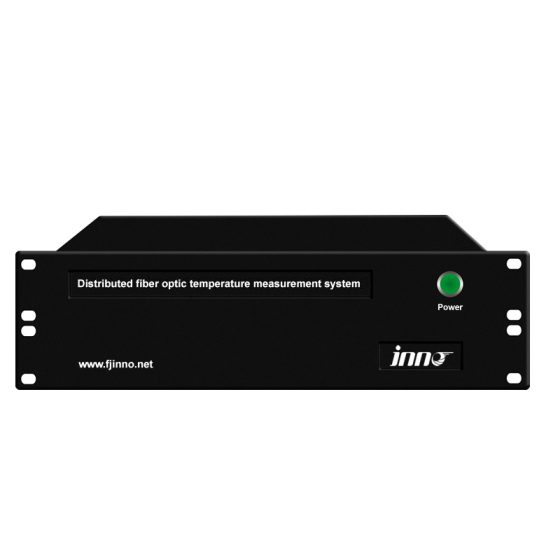
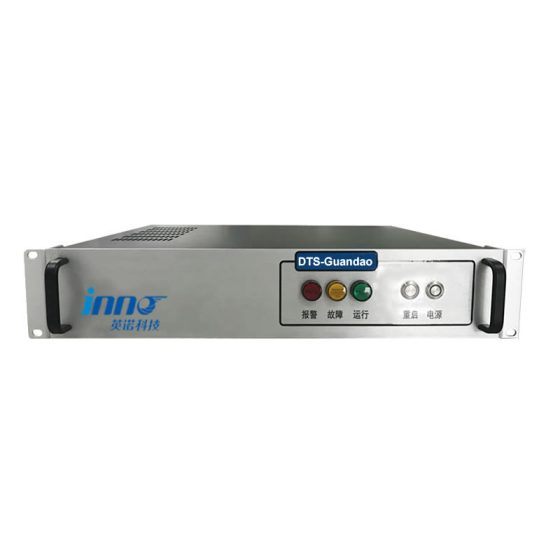
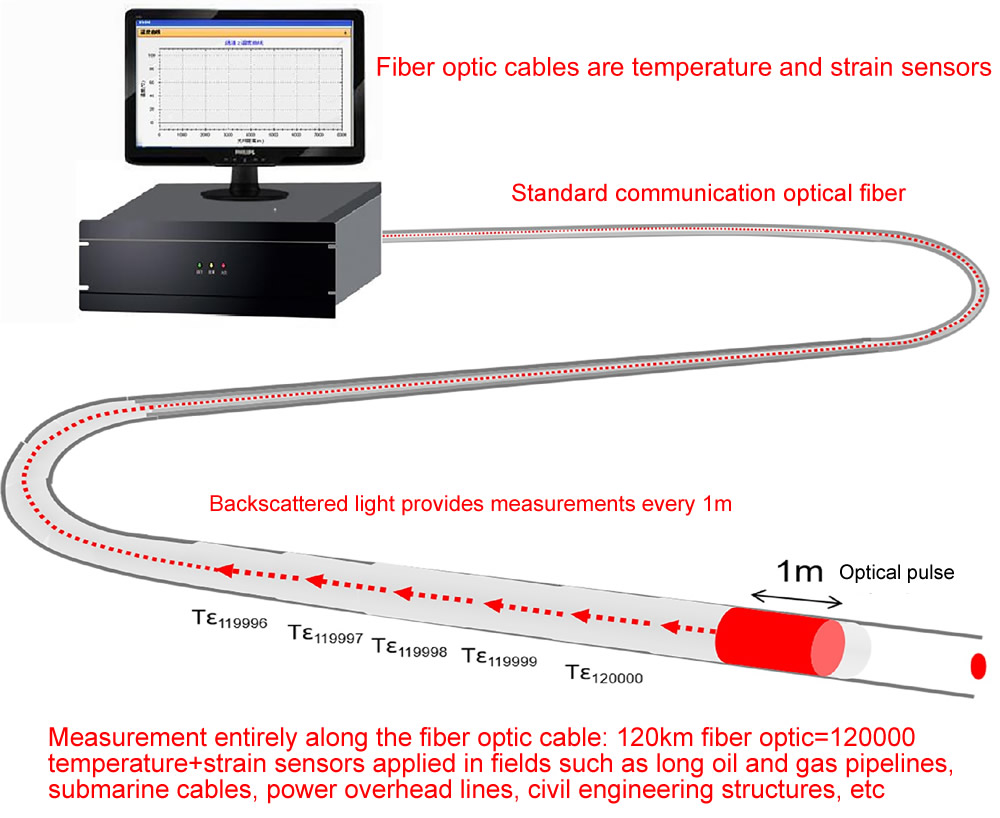
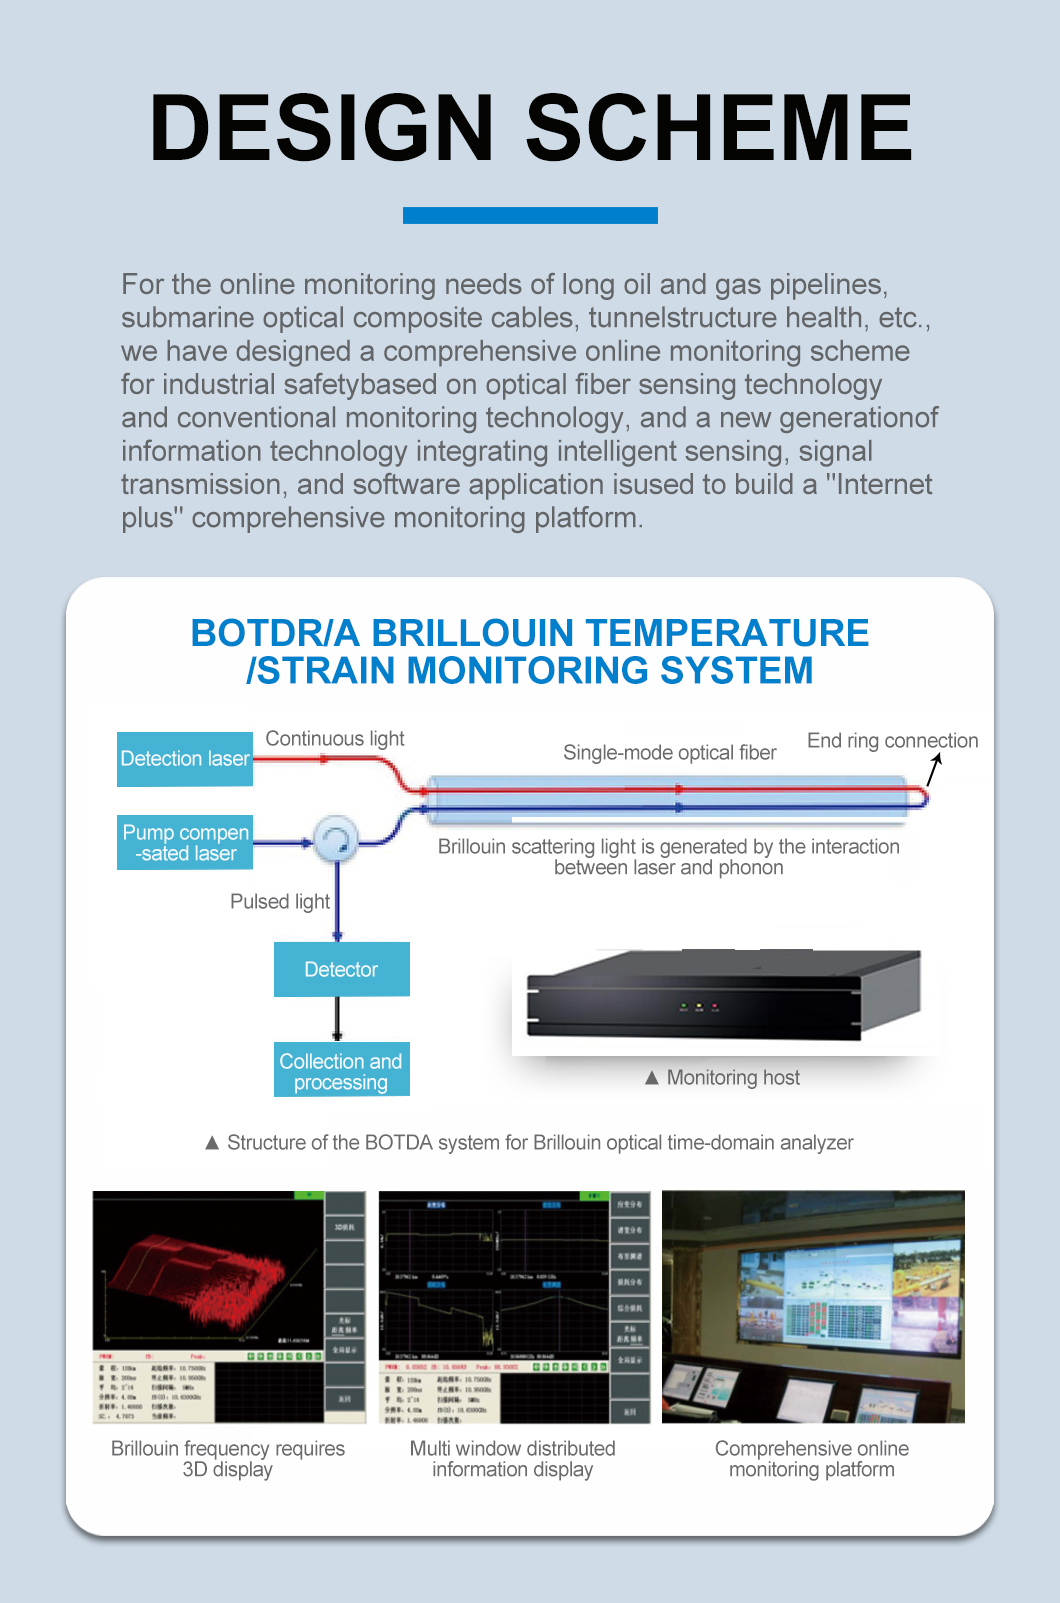
The Brillouin optical time-domain analyzer monitoring host IF-BOTDA, also known as a distributed fiber optic temperature and strain sensor, adopts the fiber optic Brillouin backscatter effect and the principle of optical time-domain reflection OTDR. It is the latest generation of distributed fiber optic sensors in the world, which can achieve temperature, strain, and spectrum measurement at various points along the optical fiber for ultra long distances. The maximum measurement distance is up to 60km, the measurement accuracy is 1 ℃/20ue, and the measurement time is 60s. The system uses standard communication single-mode optical fibers as sensors, which combine transmission and sensing, and can monitor subtle temperature and strain changes in real time. It has important applications in fields such as long-distance oil and gas pipelines, submarine optoelectronic composite cables, power overhead lines, dams, bridges, മുതലായവ.
Functional characteristics
Ultra long distance continuous distributed measurement, with a maximum measurement distance of 120km
Temperature, strain, and frequency should be measured
High measurement accuracy, stable and reliable measurement
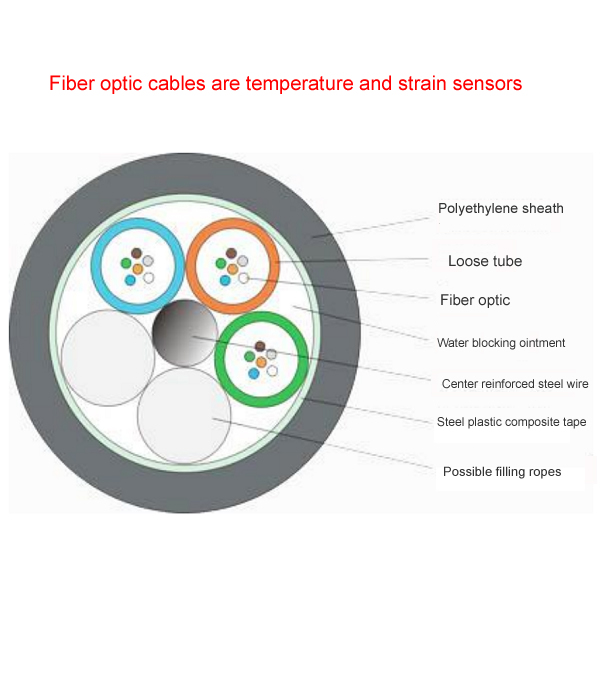
Frequency absolute encoding, unaffected by fluctuations in light source intensity, fiber optic micro bending, fiber optic hydrogen loss, മുതലായവ. Single mode communication fiber can be directly used for sensors, സമന്വയിപ്പിക്കുന്നു “പകർച്ച” ഒപ്പം “സെൻസിംഗ്”
Brillouin optical time-domain analyzer measuring principle
When light is transmitted in optical fibers, due to the slight non-uniformity of optical properties such as density and refractive index of the fiber material, incident light will produce scattering phenomenon. Brillouin scattering is the process of light scattering generated by the interaction between light waves and sound waves when propagating in optical fibers. When the ambient temperature changes or the optical fiber undergoes deformation, both the speed of sound and the refractive index of light in the optical fiber will change, resulting in a change in Brillouin frequency shift, and the change in Brillouin frequency shift is A. There is a linear relationship between the temperature AT around the optical fiber and the axial strain Ax.

In the formula, Cx and Cx represent the temperature coefficient and strain coefficient of the fiber Brillouin frequency shift, respectively. The Brillouin fiber optic sensor adopts frequency absolute encoding, which is not affected by fluctuations in light source power, fiber splicing loss, fiber micro bending, fiber loss, മുതലായവ. The measurement accuracy is high, and the measurement is stable and reliable in the long term.
The Brillouin optical time-domain analyzer BOTDA is based on stimulated Brillouin scattering effect. It uses two ultra narrow linewidth laser sources, namely pump light (pulse light signal) and probe light (continuous light signal), to inject at both ends of the sensing fiber, measure the probe light signal at the pulse light end of the sensing fiber, and perform high-speed data acquisition and processing. When the frequency difference between the pump light and the probe light is equal to the Brillouin frequency shift in a certain region of the fiber, stimulated Brillouin amplification effect occurs in that region, and energy transfer occurs between the two light sources. By scanning and detecting the frequency of light, the Brillouin spectrum at any point along the fiber optic can be obtained, thereby obtaining distributed temperature and strain measurements. Due to the use of stimulated Brillouin amplification effect, the scattered signal at the end of the sensing fiber is effectively amplified. അതുകൊണ്ട്, BOTDA can achieve high-precision measurement of up to 60km, and the measurement performance is far superior to fiber optic sensors based on Raman scattering.
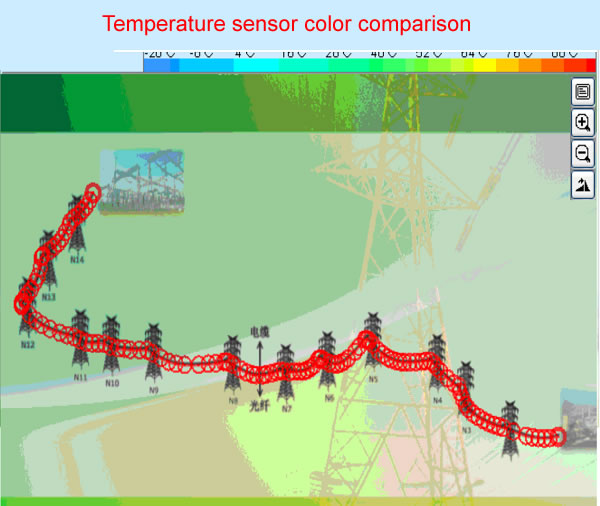
Real time data collection: Real time collection of fiber Brillouin spectrum values from the monitored area point by point, forming a real-time temperature and strain database.
Real time data display: Real time display of temperature and strain distribution curves collected from the current area.
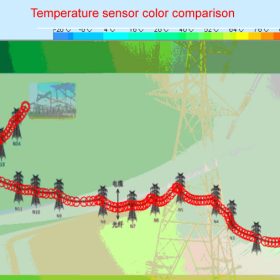
Visual view: Map the detection fiber optic cable routing and monitoring area one by one according to customer needs, and visually display the alarm location.
◆ Multiple multi-level alarms: Provides three alarm methods: fixed value, change rate, and regional difference. The alarm value can be set at multiple levels according to user requirements.
◆ Zone setting alarm: The monitored area can be divided into multiple zones, and each zone can independently set alarm values to achieve differentiated monitoring.
◆ Historical data display: Users can use the database to search for the temperature strain curve of a certain period of time in a certain area and calculate the historical trend of temperature strain changes at a certain point.
Dynamic playback of curves: Users can dynamically play temperature and strain data for a certain period of time, visually displaying the trend of changes in the entire temperature and strain curve.
 INNO ഫൈബർ ഒപ്റ്റിക് താപനില സെൻസറുകൾ ,താപനില നിരീക്ഷണ സംവിധാനങ്ങൾ.
